

ICECAP NOTE:
See the many distinguished speakers at the Heartland ICCC 7 here. Old conference talks are also linked.
The IPCC manufactures climate alarm by assuming CO2 controls water vapor to produce a runaway positive feedback system. Physicist Clive Best has posted his new paper showing that water vapor feedback is instead strongly negative, based on both the Faint Sun Paradox and a comparison of 5600 weather stations in the global CRUTEM4 temperature and humidity database. Peer-reviewed publications by Paltridge and others also find water vapor feedback is strongly negative. Without positive water vapor feedback, the IPCC’s case for catastrophic man-made climate change collapses.
Evidence for Negative Water Feedback
Posted on May 23, 2012 by Clive Best
Abstract: Positive linear climate feedback for combined water effects is shown to be incompatible with the Faint Sun Paradox. In particular, feedback values of ~2.0 W/m2K-1favored by current GCM models lead to non physical results at solar radiation levels present one billion years ago. A simple model is described whereby Earth like planets with large liquid water surfaces can self-regulate temperature for small changes in incident solar radiation. The model assumes that reflective cloud cover increases while normalized greenhouse effects decrease as the sun brightens. Net water feedback of the model is strongly negative. Direct evidence for negative water feedback is found in CRUTEM4 station data by comparing temperature anomalies for arid regions (deserts and polar regions) with those for humid regions (mainly saturated tropics). All 5600 weather stations were classified according to the Köppen-Geiger climatology [9]. Two separate temperature anomaly series from 1900 to 2011 were calculated for each region. A clear difference in temperature response is observed. Assuming the difference is due to atmospheric water content, a water feedback value of -1.5 +/- 0.8 W/m2K-1 can be derived.
I. INTRODUCTION
The Faint Sun Paradox was first proposed by Carl Sagan [1] who pointed out that the geological evidence that liquid oceans existed on Earth 4 billion years ago appears incompatible with a solar output 30% dimmer than today. The sun is a main sequence star whose output is known to increase slowly with age. The total change in solar radiation over this long period turns out to be huge ~ 87 W/m2. It has been argued that an enhanced greenhouse effect due to very high CO2 and/or CH4 concentrations could resolve this paradox [2]. However, recent geological evidence does not support CO2 as being responsible but instead the authors propose a greater ocean surface leading lower albedo as a likely solution [3]. Others have suggested that high cirrus clouds effectively warmed the Earth [4]. Although the atmosphere must have been very different before photosynthesis began, the presence of large liquid oceans still implies that clouds and water vapor played a similar role in the Earth’s energy balance then, as they do today.
The evidence is that global surface temperatures have changed rather little over the Earth’s history. It therefore seems likely that feedbacks were negative during the early lifetime of the Earth to avoid run away surface heating as the sun brightened. The continuous ~70% surface coverage of water on Earth has apparently stabilized global temperatures. A simple model of how this could work is described next, in analogy with Daisy World proposed by James Lovelock to justify Gaia theory [7].
---------------
IV. CRUTEM4 ANALYSIS
Water vapor feedback in recent climate data have been investigated by studying differences between regions with very low atmospheric water vapor (Deserts and Polar) and those regions with very large water vapor content (Tropical Wet regions). The latest CRUTEM4 data [8] consisting of 5500 individual station data covering global land areas has been studied. Each station was classified by indexing its geographic location against the Köppen-Geiger climate classification [9].
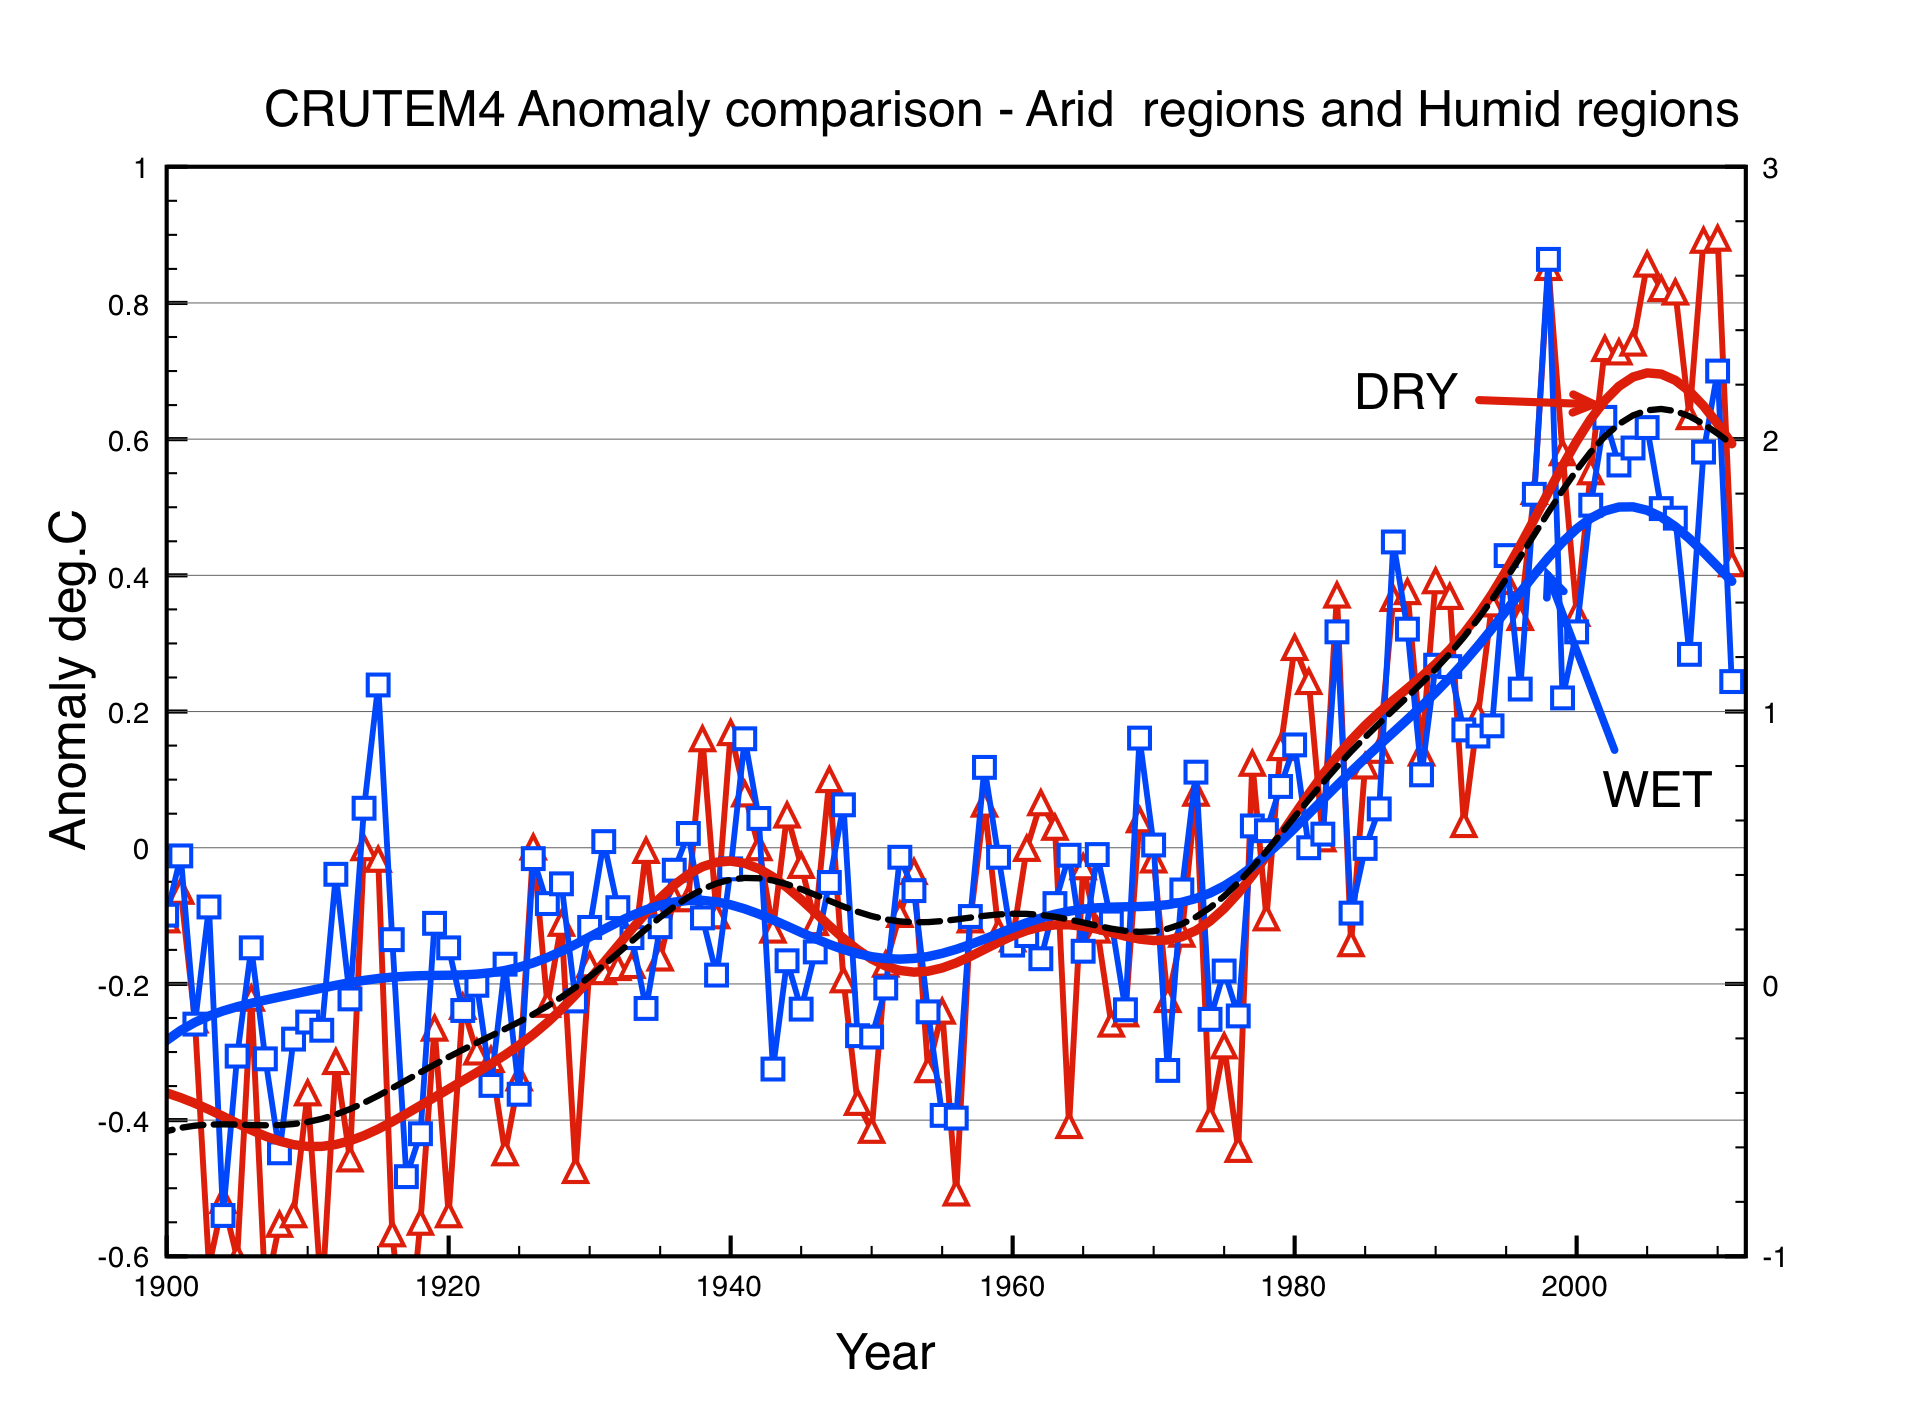
“ARID” stations are defined as those with precipitation values ‘W’ or with climate ‘E’ in [9]. These are situated either in deserts or in polar areas having the lowest atmospheric water column on Earth [10]. “WET” stations are defined as those within fully humid Tropical areas – Climate ‘A’ and precipitation ‘f’ in [9]. These are situated in tropical rain forests or year-round humid climates having the highest atmospheric water column on Earth [10]. Global anomalies have been calculated for both stations ARID and WET stations independently using the same algorithm as used for CRUTEM4. The results are shown in Figure 4.

Figure 4: Enlarged. Temperature anomalies for ARID(DRY) stations in red and WET stations in blue. The smooth curves are FFT smoothed curves. The black dashed curve is an FFT smooth to the full CRUTEM4 global temperature anomalies.
There is a clear trend in the data that ARID stations warm faster and cool faster than WET stations. They respond stronger to changes in external forcing. The WET humid stations respond less than both the ARID stations and the global average.
This is compatible with the value needed to resolve the Faint Sun Paradox. As has been pointed out by Lindzen [11] and others, much of the Earth’s heat is transported bodily through evaporation and convection to the upper atmosphere where IR opacity is low and can then escape to space. Therefore water feedback effects depend mostly on the water vapor content of the upper atmosphere. Increased evaporation, convection and consequent rain out could then result in lower humidity in the upper atmosphere. This is a possible mechanism for negative feedbacks in the tropics. Such effects would be largely absent in ARID areas, which have no local sources of evaporation.
V. CONCLUSIONS
The Faint Sun Paradox effectively rules out constant positive climate feedbacks for water. The evidence supports the hypothesis that the Earth’s oceans have stabilized temperatures for the last 4 billion years. It is proposed that the net effect of a surface with 70% water coverage self regulates Earth’s climate. A simple model that demonstrates how this could arise has been described. The model leads to average temperatures increasing by just 5 degrees over 4 billion years. This leads to predicted negative feedbacks from water of about -2 watts/m/C. Direct evidence that the temperature response from arid and humid land regions on Earth are different has been identified in CRUTEM4 data. Assuming that these divergences are only due to atmospheric water vapor differences a measured negative feedback for water of 1.5+/-0.8 watts/m/C. This agrees with that needed to explain the Faint Sun Paradox.
REFERENCES
1. Sagan, C.; Mullen, G. (1972). “Earth and Mars: Evolution of Atmospheres and Surface Temperatures”. Science 177 (4043): 52-56. 1972
2. Pavlov, Alexander A.; Kasting, James F.; Brown, Lisa L.; Rages, Kathy A.; Freedman, Richard (May 2000). “Greenhouse warming by CH4 in the atmosphere of early Earth”. Journal of Geophysical Research 105
3. Hsien-Wang Ou, Possible Bounds on the Earth’s Surface Temperature, Journal of Climate, Vol 14, 2976, 2000.
4. Roberto Rondanelli and Richard Lindzen (2010) Can thin cirrus clouds in the tropics provide a solution to the faint young Sun paradox, Journal Geophys Research Vol 115, D02108
5. Myhre et al, New estimates of radiative forcing due to well mixed greenhouse gases, Geophysical Research Letters (1998)
6. S. Bony et al. How well do we understand and evaluate Climate Change Feedback Processes, Journal of Climate, Vol 19, P. 3445, 2006
7. Lovelock, J. E. (1983b), Daisy world -A cybernetic proof of the Gaia hypothesis, CoEvol. Q., Summer, 66 - 72
8. Jones, P.D., Lister, D.H., Osborn, T.J., Harpham, C., Salmon, M. and Morice, C. 2012: Hemispheric and large-scale land-surface air temperature variations: An extensive revision and an update to 2012. J. Geophys. Res. 117, D05127
9. Rubel, F., and M. Kottek, 2010: Observed and projected climate shifts 1901-2100 depicted by world maps of the Koppen-Geiger climate classification. Meteorol. Z., 19, 135-141
10. H. Schrijver, A. M. S. Gloudemans, C. Frankenberg, and I. Aben, Water vapour total columns from SCIAMACHY spectra in the 2.36µm window, Atmos. Meas. Tech., 2, 561-571, 2009
11. Richard Lindzen, Some uncertainties with respect to water vapor’s role in climate sensitivity. Proceedings NASA workshop on the role of Water Vapor in Climate Processes, 1990.
Postscript: The above paper was submitted to Geophysics Research Letters on April 25th. The editor later rejected it on the grounds that “the work appears to represent an incremental advance in our understanding of a problem that has already received attention in the peer-reviewed literature, and extends its conclusions beyond what is supported by the research methods and results”. You are invited to decide for yourself whether that is true or not.
By Steven Hayward, Powerline Blog
I have commented before about the political problems of the scientific community, which are typically being turned around against Republicans. In a post last month I recalled the 2004 remark by Harvard geneticist Richard Lewontin in the New York Review of Books that “Most scientists are, at a minimum, liberals,” and the caution of MIT’s Kerry Emanuel about the dangers of “group think” and the “shocking lack of political diversity among American academics.” He concluded that “Until this profound and well-documented intellectual homogeneity changes, scientists will be suspected of constituting a leftist think tank.”

John Holdren, Age 68
Well, this week the National Academy of Sciences had a chance to do something about this, and ....completely blew it. A two-day symposium on science and public policy featured a panel of presidential science advisers, but the panel included only advisers to Democratic presidents, including Obama’s science adviser, the egregious John (sterilize the public) Holdren. The others were two advisers for Bill Clinton, and Jimmy Carter’s science adviser, the 87-year-old Frank Press.
Conspicuously missing from the panel was President Reagan’s science adviser Jay Keyworth, who is a spry 72. (He turns out to be the only living GOP science adviser.) When asked why Keyworth wasn’t invited, NAS president Ralph Cicerone said, “We didn’t want to go back that far.”

Jay Keyworth, speaking recently at the University of Colorado
So let’s see: having Jimmy Carter’s 87-year-old science adviser apparently isn’t “going back that far,” but having Reagan’s still active 72-year old science adviser would be? And please tell me again why we shouldn’t regard scientific elites with suspicion?
Maybe the NAS should put together a panel to explore the strange bubble around the scientific establishment that distorts its outlook on the world. I used to respect Cicerone, in part for staring down the enviros when they tried to prevent an NAS panel on geoengineering. But no more. These people deserve every calumny thrown their way.
Lawrence Solomon, FP Comment

A wind farm in the U.K., which now has 12 million people living in fuel poverty.
Climate mania impoverishes electricity customers worldwide
Global-warming-related catastrophes are increasingly hitting vulnerable populations around the world, with one species in particular danger: the electricity ratepayer. In Canada, in the U.K., in Spain, in Denmark, in Germany and elsewhere the danger to ratepayers is especially great, but ratepayers in one country - the U.S. - seem to have weathered the worst of the disaster.
America’s secret? Unlike leaders in other countries, which to their countries’ ruin adopted policies as if global warming mattered, U.S. leaders more paid lip service to it. While citizens in other countries are now seeing soaring power rates, American householders can look forward to declining rates.
The North American exemplar of acting on the perceived threat of global warming is Ontario, which dismantled one of the continent’s finest fleets of coal plants in pursuit of becoming a green leader. Then, to induce developers to build uneconomic renewable energy facilities, the Ontario government paid them as much as 80 times the market rate for power. The result is power prices that rose rapidly (about 50% since 2005) and will continue to do so: Ontarians can expect power prices that are 46% higher over the next five years, according to a 2010 Ontario government estimate, and more than 100% higher according to independent estimates. The rest of Canada may not fare much better - the National Energy Board forecasts power prices 42% higher by 2035, while some estimates have Canadian power prices 50% higher by 2020.
The story throughout much of Europe is similar. Denmark, an early adopter of the global-warming mania, now requires its households to pay the developed world’s highest power prices - about 40¢ a kilowatt hour, or three to four times what North Americans pay today. Germany, whose powerhouse economy gave green developers a blank cheque, is a close second, followed by other politically correct nations such as Belgium, the headquarters of the EU, and distressed nations such as Spain.
The result is chaos to the economic well-being of the EU nations. Even in rock-solid Germany, up to 15% of the populace is now believed to be in “fuel poverty” - defined by governments as needing to spend more than 10% of the total household income on electricity and gas. Some 600,000 low-income Germans are now being cut off by their power companies annually, a number expected to increase as a never-ending stream of global-warming projects in the pipeline wallops customers. In the U.K., which has laboured under the most politically correct climate leadership in the world, some 12 million people are already in fuel poverty, 900,000 of them in wind-infested Scotland alone, and the U.K. has now entered a double-dip recession.
The U.S., in contrast, will see power rates decline starting next year, according to the U.S. Energy Information Administration, dropping by more than 22% by the end of the decade and then staying flat to 2035. Why the fall? Mainly because the U.S. will rely overwhelmingly on fossil fuels in the years ahead, not just coal, which dominates the current power system, but increasingly natural gas, which is expected to account for 60% of all new generating capacity in the future. Thanks to fracking, the U.S. effectively has limitless amounts of inexpensive natural gas to add to its limitless coal.
While the rest of the developed world was in thrall to global-warming rhetoric, the U.S. talked the talk but balked at following through. In 1997, then president Bill Clinton and his vice-president, Al Gore, happily signed on to the Kyoto Treaty, which coerced the countries of the developed world into compromising their economies in order to save the planet. While other nations then dutifully complied, the U.S. Senate - as Clinton and Gore knew it would - refused to ratify Kyoto by a 95-0 vote. Clinton’s successor, George W. Bush, did an equally superb job of talking but balking at taking economy-killing measures. Bush successor Barack Obama, although a global-warming true believer, also put global warming on the back burner, preferring to make Obamacare, rather than climate change, his signature issue.
With the Republicans all but certain to control the purse strings following the November elections by dint of a majority in the House of Representatives, European-style legislation in the U.S. in aid of global warming will be impossible, even if the Republicans don’t also capture the Senate and the White House, as polls now indicate they will. In the event of a Republican sweep, the gap between power prices in the U.S. and the rest of the developed world will increase even more as “Drill, baby, drill” Republicans remove the existing restraints on the U.S. fossil-fuel industry, and slash the remaining subsidies on the U.S. renewable-energy industry.